
Python For Data Analysis Career Quick Facts (Global 2026)
Indicative Salary Ranges:
While compensation varies heavily by region and employer, these are typical illustrative ranges for Python For Data Analysis roles.
| Role Level | Example Remote Range (USD/yr) |
|---|---|
| Junior / Associate | $40,000 – $75,000 |
| Mid-Level | $70,000 – $110,000 |
| Senior / Lead | $120,000+ |
Table of Contents
1. What Is Data Analysis? 2. Why Python Is the Best Language for Data Analysis 3. Real-World Applications of Python Data Analysis 4. Understanding the Data Analysis Process 5. Essential Python Libraries 6. Understanding Structured Data 7. Working with CSV Files 8. Data Cleaning 9. Exploratory Data Analysis (EDA) 10. Why Visualisation Matters 11. Careers That Use Python Data Analysis 12. Common Beginner Mistakes 13. Setting Up Your Python Environment 14. Why Jupyter Notebook Is So Popular 15. Importing Data 16. Exploring Your Dataset 17. Data Cleaning Techniques 18. Working with Pandas DataFrames 19. Filtering Data 20. Sorting Information 21. Grouping Data 22. Descriptive Statistics 23. Data Visualisation 24. Working with Large Datasets 25. Automating Repetitive Tasks 26. Real-World Projects 27. Integrating Python with SQL 28. Best Practices for Data Analysis 29. Career Opportunities 30. How to Continue LearningDid you know that data is now considered one of the world's most valuable resources? It's true! Every time you browse the web, shop for your favorite items, scroll through social media, binge-watch a show, or tap your card at a store, you're generating new data. Today, businesses, governments, healthcare teams, and researchers are leaning on all this information to make smarter, more empathetic decisions, improve our everyday services, and even predict what's coming next.
But here's the catch: raw data on its own isn't all that useful. Think of it like a messy room it needs to be cleaned up, organised, closely looked at, and beautifully visualised before we can uncover its true value. This fascinating journey from raw numbers to meaningful insights is what we call data analysis.
So, where does Python fit in? Out of all the programming languages out there, Python has proudly become the global go-to standard for analysing data. Why? Because it’s wonderfully straightforward! Its simple syntax feels almost like reading plain English, and its massive ecosystem of ready-to-use libraries gives you superpowers, making it a favorite for absolute beginners and seasoned pros alike.
Whether you're dreaming of becoming a Data Analyst, a Data Scientist, a Machine Learning Engineer, or even an AI Developer, diving into Python for data analysis is honestly one of the smartest and most rewarding investments you can make for your future.
In this guide, we're going to walk together through the core concepts of Python data analysis. We'll explore why Python is so beloved in the industry and get hands-on with the essential tools that professionals use every single day. Ready? Let's dive in!
What Is Data Analysis?
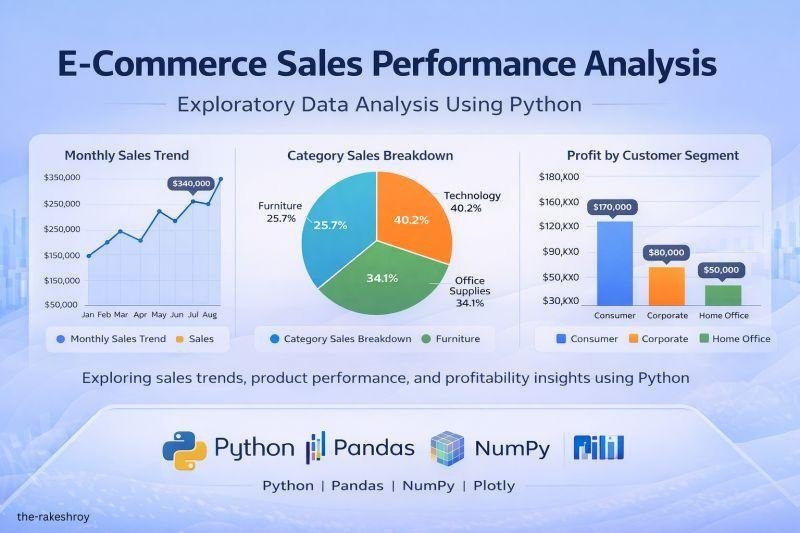
At its heart, data analysis is the art of examining, cleaning, organising, transforming, and interpreting data to reveal a clear picture that helps us make better, more informed choices.
Instead of just guessing or going with a gut feeling, organisations dive into real-world data to answer pressing questions, like:
- Which of our products are people loving the most?
- What's making our customers step away?
- Which of our creative marketing campaigns are truly connecting?
- How can we help hospitals provide better, more compassionate patient care?
- What really helps our students shine and succeed?
- Are there any sketchy financial transactions we need to catch?
By simply taking the time to listen to what the data is saying, businesses can spot trends, uncover hidden patterns, and seize exciting opportunities they might have otherwise missed.
Why Python Is the Best Language for Data Analysis
You might be wondering why Python has completely taken over the data analysis world. Well, there are a few genuinely fantastic reasons!
Easy to Learn
First off, Python is incredibly welcoming. Its syntax is clean, readable, and beautifully intuitive, making it a breeze even if you've never written a line of code in your life. This means you get to focus on the fun part understanding your data rather than wrestling with confusing programming rules.
Powerful Library Ecosystem
Python comes with a treasure trove of thousands of open-source libraries custom-built for data analysis, machine learning, and gorgeous visualisations.
Think of these libraries as pre-packaged toolkits that save you endless hours of work, letting you achieve complex tasks with just a few lines of code.
Strong Community Support
You're never alone when you're coding in Python! Millions of passionate developers, researchers, and educators are constantly sharing tutorials, guides, and open-source projects. Whenever you hit a roadblock, there’s a whole global community ready to help you out.
Cross-Platform Compatibility
Python plays nicely with everyone. It runs smoothly on:
- Windows
- macOS
- Linux
So no matter what kind of computer you or your team are using, Python is ready to go.
Industry Adoption
It's trusted by the best. Tech giants like Google, Microsoft, Netflix, Amazon, Spotify, and Meta rely heavily on Python to power their data-driven magic every single day.
Real-World Applications of Python Data Analysis
Python is working behind the scenes in almost every industry you can imagine.
Healthcare
Hospitals and clinics use it to understand patient records, helping them improve diagnoses, tailor treatments, and spot health trends that save lives.
Banking and Finance
In the financial world, Python is a trusted partner to:
- Spot and prevent fraudulent transactions
- Analyse how investments are performing
- Carefully assess financial risks
- Predict how the market might shift
E-Commerce
Your favorite online stores use Python to understand what you love, so they can:
- Recommend products that match your style
- Make sure they never run out of your favorite items
- Offer the best possible prices
- Create a shopping experience that feels uniquely yours
Education
Schools and universities look at student performance data to figure out where learners might be struggling, helping teachers step in and make a real difference.
Sports Analytics
Even professional sports teams are in on it! They analyse player stats, match history, and fitness levels to fine-tune their strategies and build the ultimate dream team.
Government
Governments rely on data analysis to make better decisions for all of us, including:
- Understanding population changes
- Planning smoother, safer traffic routes
- Keeping an eye on public health
- Forecasting economic shifts
Understanding the Data Analysis Process
Whenever professional data analysts tackle a new project, they usually follow a very thoughtful, step-by-step journey.
Step 1: Collect Data
The first step is gathering the raw materials. This data can come from so many places, like:
- Databases
- Handy CSV files
- Good old Excel spreadsheets
- APIs from other apps
- Customer surveys
- Websites
- Smart sensors
Step 2: Clean the Data
Let's be honest, real-world data is often a bit of a mess! It usually has:
- Missing or blank values
- Annoying duplicate records
- Typos and incorrect entries
- Weird formatting quirks
Taking the time to lovingly clean this data is crucial because better data means much better, more reliable insights.
Step 3: Explore the Data
Next, analysts put on their detective hats to really get to know the data. They look for:
- What types of data they're dealing with
- Hidden relationships between variables
- How the numbers are distributed
- Interesting patterns
- Outliers that don't quite fit the mold
Step 4: Analyse
This is where the magic happens! Using clever statistical techniques, analysts start answering those big business questions and pulling out meaningful stories from the numbers.
Step 5: Visualise
Because nobody loves staring at endless tables of numbers, we turn those insights into beautiful charts and graphs that anyone can understand at a glance.
Step 6: Share Insights
Finally, we share our exciting discoveries and provide actionable recommendations, empowering decision-makers to take the next right step with confidence.
Essential Python Libraries
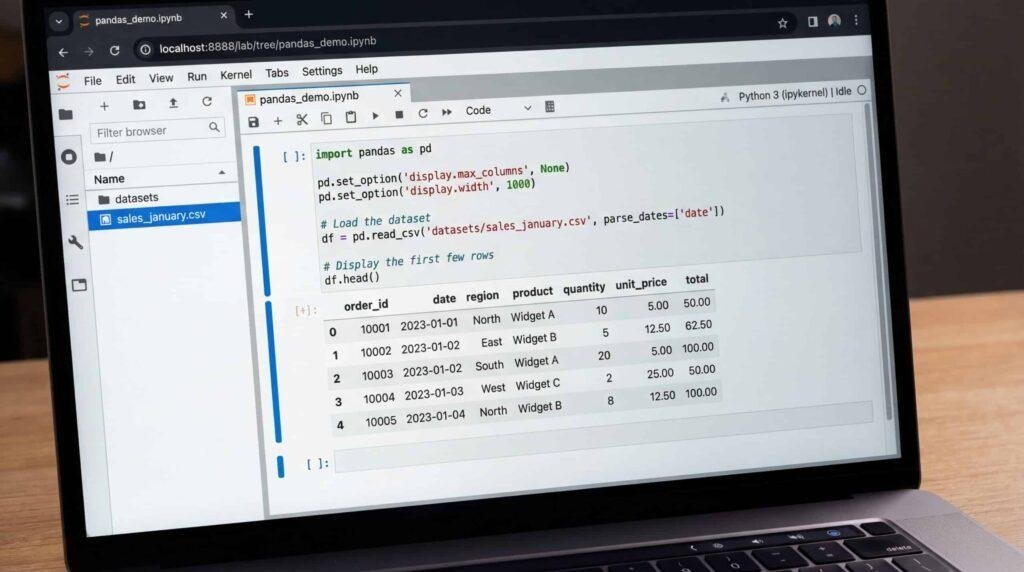
One of the absolute best things about Python is its rich family of supportive libraries.
NumPy
Meet NumPy, your best friend for anything involving heavy numbers.
It’s incredibly fast and helps you with:
- Working with complex arrays
- Crunching mathematical calculations
- Handling matrix operations
- Doing serious scientific computing
In fact, many of your other favorite Python libraries are actually built right on top of NumPy!
Pandas
If there’s one library you need to know, it’s Pandas. It is the absolute heart of Python data analysis.
Pandas makes it incredibly easy to:
- Read in your datasets
- Tidy up messy data
- Filter out the noise
- Group related information
- Stitch different tables together
- Calculate important statistics
If you're serious about this journey, becoming best friends with Pandas is a must.
Matplotlib
When it’s time to show off your findings, Matplotlib is one of Python’s most popular and trusted visualisation tools.
It gives you the power to create:
- Elegant line charts
- Clear bar charts
- Colorful pie charts
- Insightful scatter plots
Histograms
Visualisations are so incredibly important they help turn intimidating walls of text into stories that resonate with people.
Scikit-learn
While Scikit-learn is famous for being a powerhouse in machine learning, it also packs some wonderful tools for prepping and analysing your data.
It’s fantastic for:
- Getting your data ready for the spotlight
- Categorising information (Classification)
- Predicting continuous numbers (Regression)
- Finding natural groupings (Clustering)
- Making sure your models are actually working (Evaluation)
Understanding Structured Data
When you're first starting out, most of the datasets you'll play with will be neatly organised into familiar rows and columns.
Think of it like a simple class roster:
- Student | Marks | Attendance
- Ahmed | 89 | 94%
- Sara | 92 | 97%
- Ali | 76 | 88%
Every single row tells the story of one specific record (like a student).
Every column tells you a different detail (or feature) about them.
And guess what? Pandas was lovingly designed specifically to make working with this kind of structured data an absolute joy.
Working with CSV Files
You'll hear about CSV (Comma-Separated Values) files a lot. They are everywhere in the data world!
Businesses absolutely love CSV files because they are:
- Wonderfully simple
- Super lightweight
- Incredibly easy to share with anyone
- Friendly with almost every data tool out there
With Python, bringing in, tweaking, and saving out CSV files is fast, painless, and highly efficient.
Data Cleaning
Here's a little secret: professional analysts usually spend way more time lovingly cleaning their data than actually analysing it.
Some of the usual housekeeping tasks include:
- Clearing out annoying duplicate entries
- Figuring out what to do with missing values
- Fixing little spelling mistakes
- Making sure all the dates look the same
- Converting data into the right formats
- Tossing out columns you just don't need
Taking the time to clean your data means you can trust your final analysis that much more.
Exploratory Data Analysis (EDA)

Before you ever start building fancy reports or models, you need to just sit down and get a feel for what your data is telling you.
This phase, known as EDA, helps you answer fun questions like:
- What values are popping up the most?
- Is there anything that looks completely out of place?
- Are some of these variables secretly connected?
- Does this data change with the seasons?
- Is our dataset nice and balanced?
Taking a curious stroll through your data almost always reveals incredible insights you weren't even looking for!
Why Visualisation Matters
Let's face it: our human brains process a beautiful picture so much faster than a boring spreadsheet.
Imagine trying to understand five years of daily sales data.
Scrolling through thousands of rows is enough to make anyone's eyes glaze over.
But when you turn it into a clean, simple line graph, you can instantly see:
- Exciting growth spurts
- Unexpected dips
- Fun seasonal trends
- Sudden, surprising shifts
That immediate "aha!" moment is exactly why learning to visualise your data is such a vital, rewarding skill.
Careers That Use Python Data Analysis
Knowing Python for data analysis opens up a world of incredibly fulfilling career paths.
Some roles you could explore include:
- Data Analyst
- Business Analyst
- Data Scientist
- Machine Learning Engineer
- Financial Analyst
- Marketing Analyst
- Research Analyst
- Healthcare Data Analyst
- AI Engineer
- Business Intelligence Developer
The best part? Because so many companies are eager to make data-driven decisions, the demand for these kind, curious, and skilled professionals is only growing.
Common Beginner Mistakes
As you take your first steps into Python data analysis, don't worry if you stumble! Just try to watch out for these common little traps:
Rushing past the basic Python fundamentals.
Skipping over the crucial data cleaning step.
Diving straight into complex machine learning before getting comfortable with basic analysis.
Practicing on messy, low-quality datasets.
Misreading what a chart or statistic is actually telling you.
Forgetting to leave helpful notes and document your process.
Watching too many tutorials without actually writing the code yourself.
Take your time, build a strong foundation, and everything else will feel so much more natural later on.
Setting Up Your Python Environment
Before we can start playing with data, we need to set up a cozy workspace on your computer.
Most beginners start with one of these friendly tools:
- Jupyter Notebook
- Visual Studio Code
- PyCharm
- Google Colab
- Anaconda Distribution
They are all fantastic, but they each cater to a slightly different style of working.
If you're just starting out, Jupyter Notebook and Google Colab are usually the most welcoming. They let you write a little code, immediately see your charts, and add your own thoughts all in one beautiful, scrolling document.
Why Jupyter Notebook Is So Popular
There's a reason everyone loves Jupyter Notebook when learning data analysis it just feels right.
With Jupyter, you get to:
Take your time and write your Python code step by step.
See your data tables pop up instantly.
Watch your charts and graphs come to life right beneath your code.
Add your own notes, stories, and explanations using simple text blocks.
Easily save your progress and share your discoveries with friends or colleagues.
Instead of running one giant, intimidating program, you can test things out piece by piece. It takes the stress out of debugging and makes the whole learning process feel like a fun conversation with your data.
Importing Data
The very first hands-on step of your analysis adventure is bringing your data into Python.
You’ll often be welcoming data from places like:
- CSV files
- Excel spreadsheets
- SQL databases
- JSON files
- Web APIs
- Cloud storage buckets
- Your company's business management systems
Thankfully, Python has wonderful tools that make importing this data safe, quick, and reliable.
Once it's safely imported, the real fun begins: you can explore it, clean it up, and gently mould it to uncover its secrets.
Exploring Your Dataset
Before jumping to any big conclusions, it’s super important to gently familiarise yourself with the shape and feel of your data.
A good analyst will usually take a moment to check:
- How many rows are we working with?
- How many columns are there?
- What kind of data lives in each column?
- Are there any missing pieces to the puzzle?
- Did any rows get accidentally duplicated?
- What makes each value unique?
- What do the basic statistics look like?
Doing this little health check early on saves you from frustrating surprises down the road!
Data Cleaning Techniques
Let's be real the data you find in the wild is almost never perfect.
Here are a few little hiccups you’ll learn to gracefully handle:
Missing Values
Sometimes, people forget to fill out a form, and you end up with blank spots.
As an analyst, you get to decide if it's best to gently remove those incomplete records or if you can make a smart, educated guess to fill in the blanks.
Duplicate Records
Seeing double? Duplicate entries can throw off your totals and lead you astray.
Clearing out the copies makes sure your final insights are trustworthy and true.
Incorrect Formatting
Maybe half your dates say "Jan 1" and the other half say "01/01". Smoothing out these formatting quirks ensures everything plays nicely together.
Incorrect Data Types
Sometimes numbers get disguised as text, or dates are stored as plain words.
Gently correcting these types is a crucial step so your calculations come out exactly right.
Working with Pandas DataFrames
When you use Pandas, you'll spend a lot of time with something called a "DataFrame."
Think of a DataFrame as a deeply intelligent, supercharged spreadsheet.
Unlike the spreadsheets you're used to, DataFrames effortlessly handle:
- Lightning-fast searching
- Complex filtering
- Quick sorting
- Deep statistical math
- Shape-shifting data transformations
- Seamlessly weaving multiple datasets together
Because they are so incredibly flexible and powerful, DataFrames will quickly become your favorite companion in almost every Python project.
Filtering Data
When you're staring at datasets with thousands or even millions of rows, it can feel overwhelming.
Filtering is your way of gently asking the data to only show you exactly what you care about right now, so you can focus on answering one specific question at a time.
Sorting Information
Just like organizing a messy closet, sorting puts all your records into a clean, logical order so you can easily spot the highest highs and the lowest lows.
Grouping Data
Grouping is a lovely way to bring together records that share something in common, helping you see the bigger picture across different categories.
Descriptive Statistics
Descriptive statistics are just friendly numerical summaries that give you the quick "TL;DR" of your data.
You'll frequently use handy measures like:
- Mean (the classic average)
- Median (the true middle ground)
- Mode (the most popular kid in class)
- Minimum value (the absolute lowest)
- Maximum value (the very highest)
- Standard deviation (how spread out things are)
- Variance (another way to measure the spread)
Data Visualisation
Visualisation is where you get to be creative! It’s all about translating dense numbers into visually striking charts that anyone can grasp.
Some of the classic favorites you'll create include:
Bar Charts
Line Charts
Pie Charts
Scatter Plots
Histograms
Working with Large Datasets
In our modern world, organisations are generating truly staggering amounts of information every single day.
Automating Repetitive Tasks
Tired of doing the exact same data chores every week? Python is wonderfully skilled at automating those repetitive tasks so you can focus on the fun stuff.
Real-World Projects
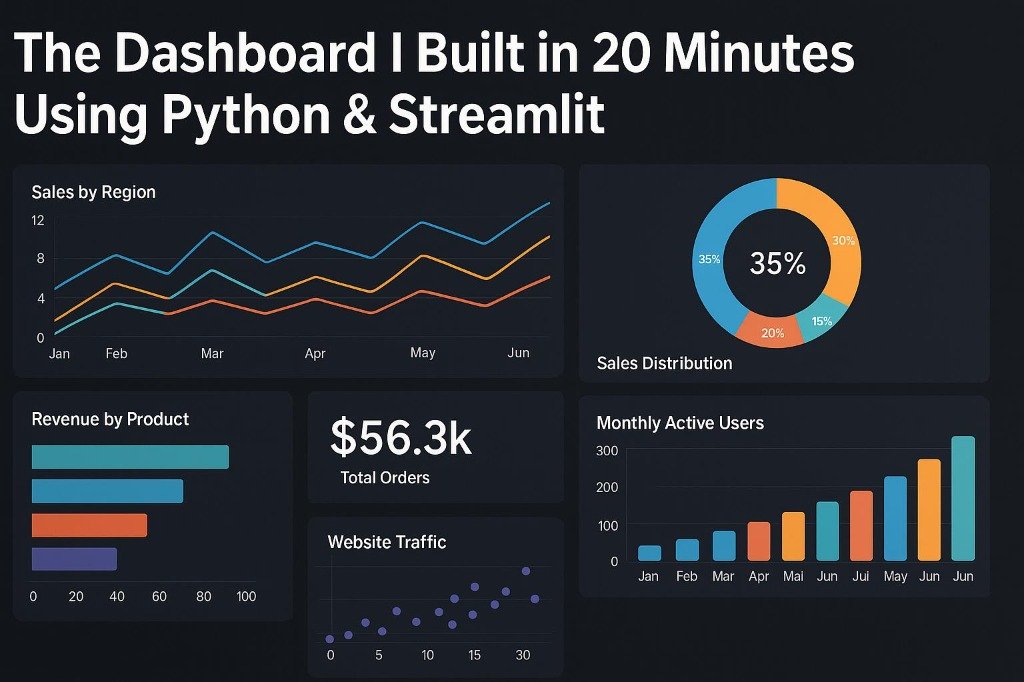
As you grow more comfortable with Python, you'll start building projects that bring real value to yourself and others.
Some inspiring ideas to get you started include:
- A beautifully interactive sales performance dashboard
- An insightful employee attendance tracker
- A supportive student performance reporting system
- A thoughtful breakdown of hospital patient statistics
- A fascinating look at local weather trends
- A personal financial expense tracker that keeps you on budget
- An intelligent customer segmentation analysis
- A deep dive into your social media analytics
- A helpful inventory management report
- A clear, easy-to-read website traffic analysis
Integrating Python with SQL
As you step into the professional world, you'll notice many organisations securely store their vast data in databases rather than simple spreadsheets.
Best Practices for Data Analysis
As you journey forward, you'll pick up some wonderful guiding principles that professional analysts rely on to keep their work accurate, ethical, and clear.
Career Opportunities
Embracing Python for data analysis genuinely opens the door to so many exciting, impactful, and rewarding career journeys.
How to Continue Learning
The learning never really stops! Once you feel at home with the basics, the best way to keep growing is simply to keep your curiosity alive and practice with messy, beautiful, real-world datasets.
Python For Data Analysis Essential Resources
Ready to take the next step? Here are the most relevant and targeted resources specifically for Python For Data Analysis: